The Atlantic Slave Trade was one of the most significant and devastating events in world history. Beginning in the 16th century and continuing until the late 19th century, it involved the forced transportation of approximately 12 million Africans from the western coast of Africa across the Atlantic Ocean to European colonies in the Americas. Enslaved people were transported to destinations across North America, South America and the Caribbean, where they were forced to work on plantations producing sugar, tobacco, cotton and other raw materials. This map was created by History Crunch to help students visualize the geographic scope of the Atlantic Slave Trade and is based on the History Crunch article titled Atlantic Slave Trade.
Atlantic Slave Trade Map
About This Map
This Atlantic Slave Trade map was created by the History Crunch team to help students and teachers understand the geographic dimensions of one of the most significant and devastating events in world history. It is designed as a visual learning tool to accompany our full article on the Atlantic Slave Trade. Teachers may use it as a classroom display, a geography activity, or a discussion starter about the causes, scale and lasting consequences of the Atlantic Slave Trade.
What This Map Shows
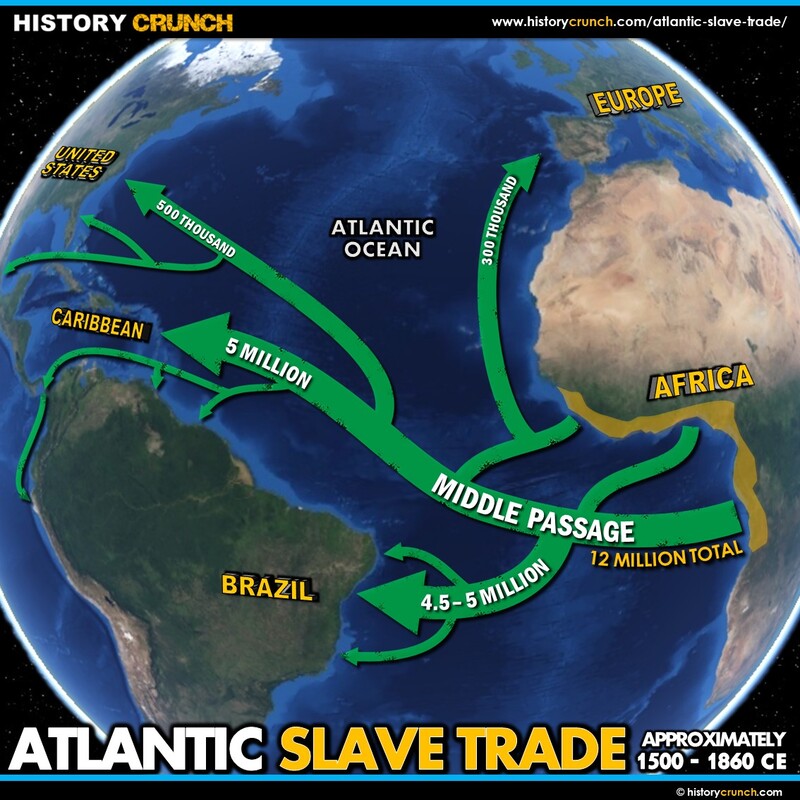
The map shows the full geographic scope of the Atlantic Slave Trade, from the regions of Africa where enslaved people were taken to the destinations in the Americas where they were sold and forced to work.
The map highlights the western coast of Africa as the primary source region for the Atlantic Slave Trade. Most enslaved Africans were taken from West and Central Africa, spanning a vast stretch of coastline from Senegambia in the north to Angola in the south. European slave traders established trading posts and forts along this coastline where they purchased enslaved people, many of whom had been captured in raids and wars conducted by African societies in the interior of the continent. It is important to note that African societies along the western coast played an active role in the trade, with some capturing people from the interior and selling or trading them to European merchants at coastal ports.
The map shows the Middle Passage route across the Atlantic Ocean, which was the most horrific leg of the journey for enslaved Africans. This crossing from the west coast of Africa to the Americas could take up to six months in the 16th century, though by the 19th century faster ships had reduced the journey to around six weeks. The conditions aboard slave ships were brutal. Enslaved people were packed tightly into the holds with minimal space, food, water or sanitation. Disease was rampant throughout the voyage and the death rate was extremely high. Historians estimate that approximately 1.2 to 2.4 million enslaved people died during the Middle Passage before ever reaching the Americas.
The map also shows the destinations across the Americas where enslaved Africans were transported and sold. The vast majority were brought to the Caribbean and South America, particularly Brazil, which received more than 4 million enslaved Africans over the course of the trade. The Caribbean islands, where sugar plantations required enormous amounts of labor, were also major destinations. Of the approximately 12 million Africans transported across the Atlantic, only around 600,000 were brought to what is now the United States, representing approximately 5 percent of the total. The major European nations involved in the Atlantic Slave Trade included Portugal, Britain, Spain, France and the Netherlands, each of which operated slave ships and colonial plantations that depended on enslaved labor.
How to Use This Map in the Classroom
This map works well as a visual introduction to the Atlantic Slave Trade before students read the full article. It can be used as a geography activity asking students to identify the regions of Africa where enslaved people were taken and trace the routes across the Atlantic to the different destinations in the Americas. Teachers may also use it as a discussion prompt asking students to consider the scale of the Atlantic Slave Trade and its lasting consequences for the people of Africa, the Americas and the world. It pairs particularly well with the Trade Triangle map and articles on the Middle Passage, the Columbian Exchange and slavery in the United States to give students a complete understanding of the broader context of Atlantic trade and colonization.
Related Articles
To learn more about the topics covered in this map, visit the following History Crunch articles: