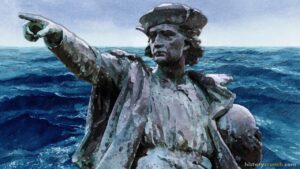
Christopher Columbus’s first voyage to the New World in 1492 was one of the most consequential journeys in the history of the world. Sailing with three ships, the Nina, the Pinta and the Santa Maria, Columbus left Spain on August 3rd, 1492 and crossed the Atlantic Ocean in search of a westward route to Asia. Instead he arrived in the Caribbean, making contact with indigenous peoples and beginning an era of European exploration and colonization that would permanently change the Americas and the world. This map was created by History Crunch to help students visualize the geographic route of Columbus’s first voyage and is based on the History Crunch article titled Christopher Columbus First Voyage.
Christopher Columbus First Voyage to the New World Map
About This Map
This map of Christopher Columbus’s first voyage to the New World was created by the History Crunch team to help students and teachers understand the geographic route of the most famous voyage of the Age of Exploration. It is designed as a visual learning tool to accompany our full article on Christopher Columbus’s first voyage. Teachers may use it as a classroom display, a geography activity, or a discussion starter about the significance and controversy surrounding Columbus and his voyages.
What This Map Shows
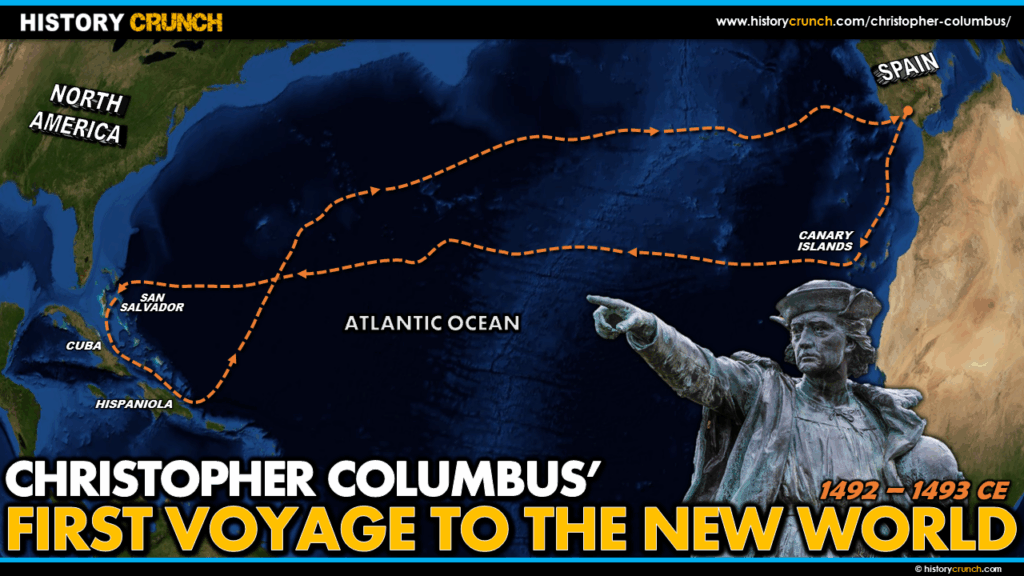
The map traces the complete route of Columbus’s first voyage from its starting point in Spain to its arrival in the Caribbean and the return journey home. Columbus departed from Palos de la Frontera in southwestern Spain on August 3rd, 1492, sailing three ships across unfamiliar waters on a journey that no European expedition had previously completed successfully.
The first key stop shown on the map is the Canary Islands, a Spanish-controlled archipelago located south of Spain in the Atlantic Ocean approximately 62 miles west of Morocco. Columbus stopped here to repair and restock his ships before departing for the open Atlantic on September 6th, 1492. The Canary Islands were an important waypoint because they provided a reliable starting point for the Atlantic crossing and allowed Columbus to take advantage of the easterly trade winds that would carry his ships westward.
The map shows the transatlantic crossing itself, which took approximately five weeks. Columbus used his knowledge of Atlantic wind patterns to follow the easterly trade winds from the Canary Islands westward toward the Caribbean. The crossing was not without risk since the ships were medium-sized vessels designed for use in the Mediterranean rather than the open ocean, and the route left them exposed to Atlantic storms and hurricanes. Columbus and his crew were fortunate to avoid them on this voyage.
The map highlights the arrival point in the Caribbean on October 12th, 1492, when a lookout aboard the Pinta spotted land. Columbus named the island San Salvador, though the indigenous Lucayan people who lived there called it Guanahani. Modern historians debate exactly which Caribbean island this was. The map then shows Columbus’s onward journey through the Caribbean, including his arrival on the eastern coast of Cuba on October 28th and his subsequent voyage to Hispaniola on December 5th, where the Santa Maria ran aground and was used to establish the settlement of La Navidad, the first permanent European settlement in the Americas.
Finally the map shows the return journey to Spain, which Columbus and his reduced crew completed aboard the Nina and Pinta, arriving back in Spain on March 15th, 1493. The news of his voyage spread rapidly across Europe and inspired many other nations including England, France and Portugal to launch their own voyages of exploration.
How to Use This Map in the Classroom
This map works well as a visual introduction to Columbus’s first voyage before students read the full article. It can be used as a geography activity asking students to trace the route from Spain to the Canary Islands and across the Atlantic to the Caribbean, identifying the key locations along the way. Teachers may also use it as a discussion prompt asking students to consider the significance of Columbus’s miscalculation about the size of the Earth and what it tells us about the limits of European geographic knowledge in 1492. It pairs particularly well with the Christopher Columbus infographic and the Columbian Exchange map to give students a complete picture of the voyages and their consequences.
Related Articles
To learn more about the topics covered in this map, visit the following History Crunch articles: